
What’s up musicians?! Do you ever find yourself sitting and staring at your Soundcloud analytics page, not really sure what to do beyond checking your weekly plays and likes? Don’t worry, you’re not alone. Getting valuable insights from statistics and analytics can often be tricky; it takes some skill to put all those numbers and info together to add up to something that makes sense. In this post we’re going to give you the rundown on Soundcloud analytics navigation, which statistics you’ll want to measure, and what this data means for you as an artist. Let’s get started.
Layout and Navigation
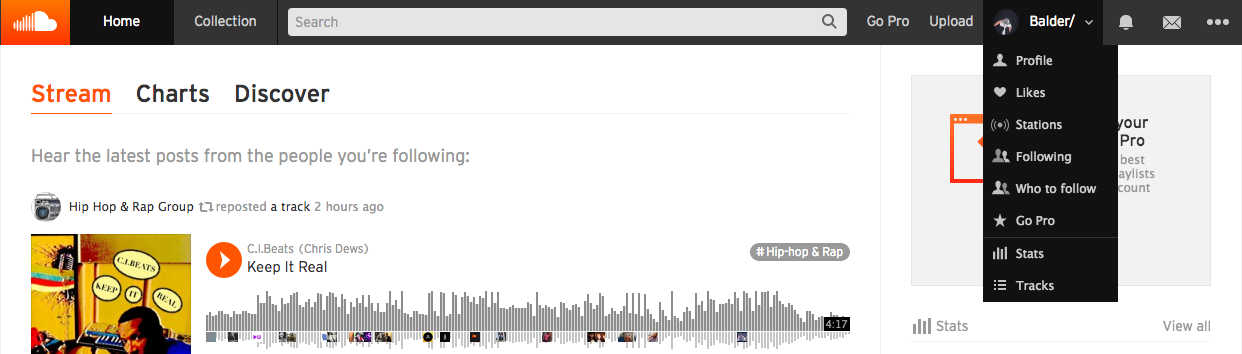
To access your Soundcloud analytics page, click on your profile icon in the top right corner of the homescreen, followed by the stats button in the drop down menu.
You should now be on the main Stats page. From here, you’ll see that the default date range shows the last 7 days. This can be changed to the last 14 days, 30 days, 12 months, or any custom date range of your choosing. For easy navigation between dates, the arrows located beneath the graph area to the left and right will move forward or backward in time based on the date range you’ve selected. For example, if you set your range to 7 days, hit the back arrow to see the previous 7 days, and the forward arrow for following 7 days. Pretty straightforward, right?
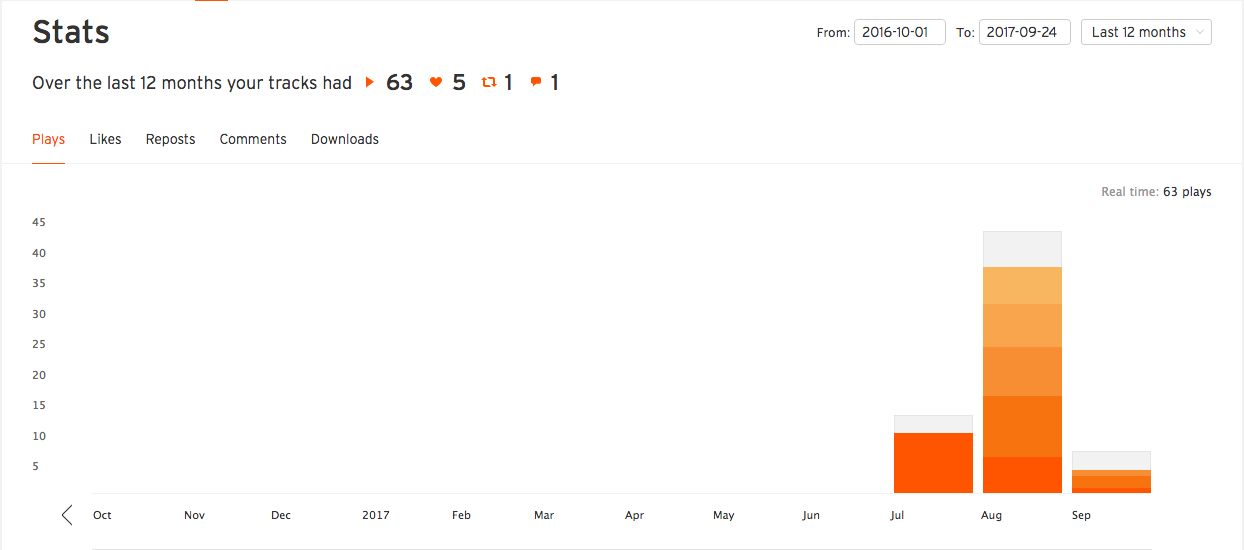
Beneath the date range options you will see a list of your uploaded tracks defaulted in order of most-least plays. You will also see these numbers laid out in a graph in the main area of the page, telling you which specific dates the different plays came from. In the upper left hand area of the stats page you will see the options for plays, likes, comments, reposts and downloads. Clicking on any of these will change the information displayed on the graph accordingly, as well as the way in which your tracks are ranked.
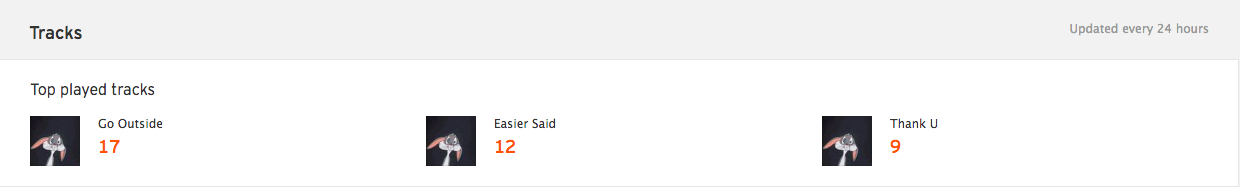
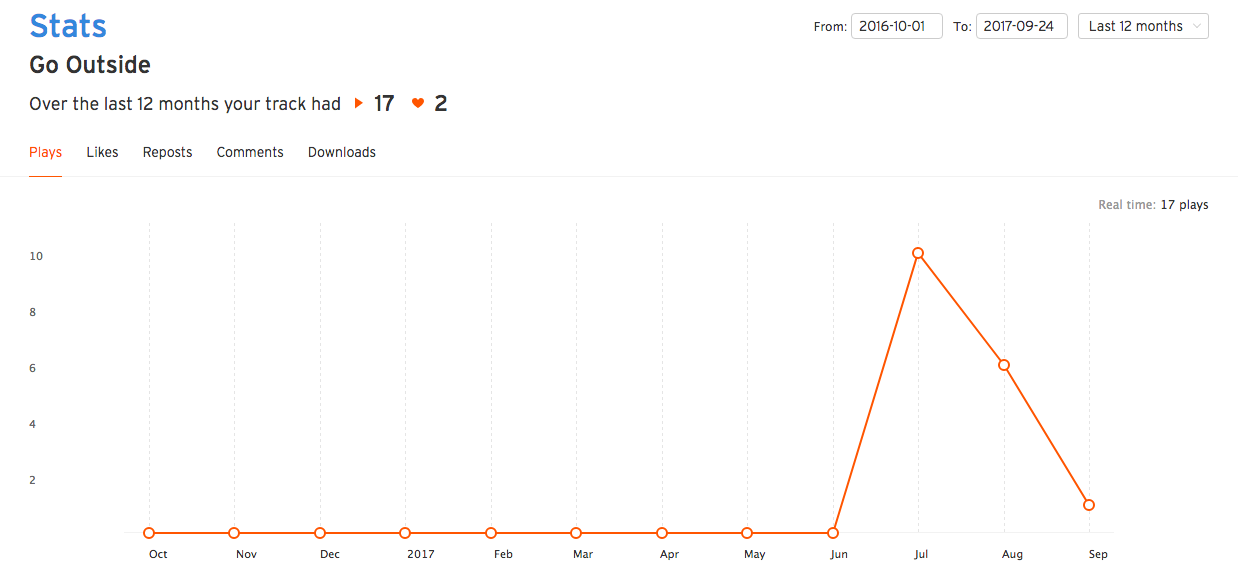
To see statistics for an individual track, simply click the name of the track you wish to isolate in the track list in the upper right hand area of the page, and the bar graph will change to a dotted line graph showing analytics for that specific track.
Basic Statistics
For the most part, the basic stats offered by Soundcloud analytics are pretty straightforward; you’ll be able to see when and with what tracks you’re getting the most plays, likes, comments, reposts and downloads. But where these stats can start to give valuable insights, are in cases especially when things don’t seem to add up.
[Tweet “it’s important to try and put yourself in the shoes of the listener #soundcloudanalytics”]
Maybe one track has less plays than another, but it has much more likes, or maybe more reposts. In these cases, it’s important to try and put yourself in the shoes of the listener. Perhaps the reason your most liked song is getting a low number of plays is from something as simple as the name, or even the image paired with the track. What is it that is different about the most played track that is getting it all of those listens?

Another great way to use these statistics is when you start using other social media platforms to push your work as well. For example, say you just uploaded a ton of promotional posts to Facebook telling people to check out your Soundcloud page. If you make note of the dates when these posts went live, you can see how it reflects in your Soundcloud analytics. You can experiment with different social platforms to see which methods of promotion and which channels bring you the best results.
Pro Unlimited Statistics
This is where Soundcloud can start to provide you with some very valuable insights. With a Pro Unlimited account, you’ll get more advanced statistics such as which specific people are listening to your tracks the most, which countries and cities give you the most plays, and which websites your listeners are coming from to get to your Soundcloud page.
Let’s start with your top listeners. This is a very valuable statistic that essentially lets you see who your biggest fans are. You can use this insight to reach out to them directly and show appreciation, ask their opinions on your music and what they’d like to hear from you in the future, and if they’re a fellow musician, collaborate!
[Tweet “ask for opinions on your music and what they’d like to hear from you in the future, and if they’re a fellow musician, collaborate! #soundcloudanalytics”]
Knowing which countries and cities are giving you the most plays is a great way to see where your biggest fan base resides. You’ll be able to see which locations your music resonates in the most, where potential marketing efforts will be the best received and what locations may need more attention, and which destinations would be best to gig at while on tour!
Arguably the most useful pro statistic is the ability to see which websites your listeners are coming from. One major benefit of this is seeing which social platforms are best for focusing your marketing efforts. For example, if the majority of your fans are coming from Facebook then you’ll definitely want to spend more time there; create more paid ads and maintain a consistent presence while engaging with your fans on a regular basis. Another benefit is the potential for finding new websites or bloggers who have linked to your tracks on their own means; this is a great way to reach out and make new connections for future collaboration!

In conclusion, you can use Soundcloud analytics as a reflection of the current standing of your music, and a great indication of what steps you should take next. We hope this post will get you started off in the right direction, but if you have any questions don’t hesitate to tweet us @thesm_artist to learn more about Soundcloud and other social media marketing tips :).